Visual Artifacts in Data Analysis

It’s difficult to overestimate the value of visualization in data analysis. Visual representations of data should not be considered the results of an analysis process, but rather the essential tools and methods that should be applied at every stage of working with data. When dealing with specific data and questions, we often find it useful to add non-standard visual elements that are adapted to characteristics of the data, goals of analysis tasks or individual and organizational requirements. We refer to such new elements as analysis artifacts, which can be defined as visual products of analysis methods, general or specific for domain and scenario, providing additional context for the results or the analysis process. There may be various goals identified for specific analysis artifacts, but their general role is to make the analysis user experience more accessible, adaptable and available.

Analysis artifacts can take many forms, from text elements, through supplementary data series, to new custom shapes and visual constructs. The simplest example are contextual text annotations, often automatically added, with details regarding the data or the process (see example). Some analysis artifacts are generic as they address data properties, like the cyclical or seasonal nature of a time series, patterns and trends (e.g. rent case study), outliers and anomalies or differences and similarities against population data. Some others are specific for a domain and/or type of an analysis task, and may be closely integrated with methods implemented in related analysis templates. In practice, we can think about different types of analysis artifacts in terms of tasks used in analysis decision support

  • SUMMARIZE the structure and quality of data, results of analysis or execution of the process
  • EXPLAIN applied analysis methods, identified patterns, trends or other interesting discoveries
  • GUIDE through the next available and recommended steps at given point of the analysis process
  • INTEGRATE the data from different sources and the results from different methods and agents
  • RELATE the results, data points, data series, big picture context, and input from different users
  • EXPLORE anomalies, changes, hypothesizes and opportunities for experimentation or side questions

Figure 1 includes an example of domain and scenario specific analysis artifact (INTEGRATE type) for stock market transactions. This artifact illustrates a single purchase of stock and subsequent sales, using historical quotes as the background. For each sale event, the information about number of sold stock, their value and gain/loss are included.

Figure 1. Analysis artifact for stock transactions, with a single purchase and multiple sales events (SVG)

Figure 1. Analysis artifact for stock transactions, with a single purchase and multiple sales events (SVG)

Analysis artifacts can be considered means for adaptation of analysis experience to the context of analysis tasks and user’s needs, requirements and preferences. They can be highly customized and personalized, leading to adaptive user experiences that are more effective and efficient in the scope of controlling the analysis processes and interpreting the results. These capabilities make analysis artifacts very powerful tools for complex decision problems and situations. They can be very useful in dealing with imperfect data, potential information overflow, operating under strong external requirements (e.g. time constraints) or in configurations with multiple participants and incompatible goals and priorities. We found that they can be also helpful beyond visualization, as the artifact-related data structures can become subjects of analysis or be applied in a completely different scope or a different scenario.

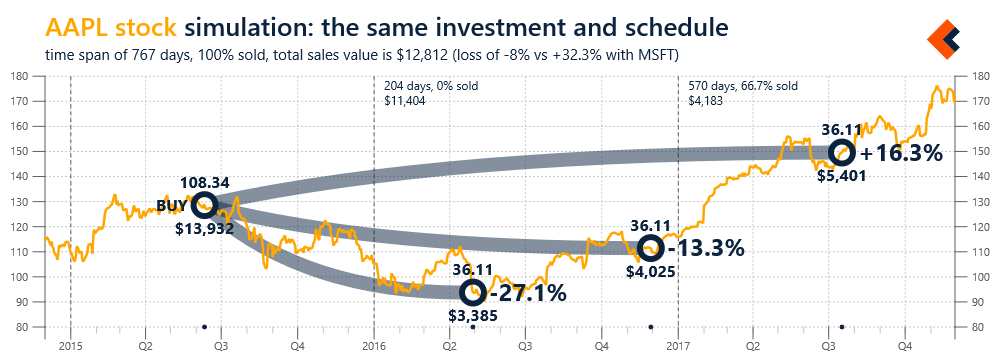
For example, Figure 2 presents a simple simulation based on the analysis artifact presented in Figure 1. The data structure related to that artifact are used here to illustrate a hypothetical scenario of investing the same amount of money in a different stock and following the same exact sales schedule (selling the same percentage of stock at each time point).

Figure 2. Simulation of the purchase and sell transactions from Figure 1 applied to a different stock (SVG, 2, 3)

Figure 2. Simulation of the purchase and sell transactions from Figure 1 applied to a different stock (SVG, 2, 3)

We think about visualization of our data as merely a canvas upon which we can paint specialized and personalized artifacts from our analysis processes. These artifacts can be applied not only in the scope of individual charts, but also for interactive decision workflows, based on multiple data sources, that may require many integrated visualizations in order to provide a sufficient context for a decision maker. This is especially important for data analysis in social context, with advanced collaboration scenarios involving multiple human participants and AI agents. As the complexity of algorithms and models is increasing, we need to provide significantly more user-friendly analysis environments for expanding number and variety of users. Multimodal interactions and technologies for virtual or mixed reality have great potential, but the best way to deal with complexity is to focus on simplicity. Analysis artifacts seem to be natural approach to that challenge and they should lead us to brand new types of data analysis experiences, which may soon be necessities, not just opportunities.

Threat modeling data analysis processes

In the previous post, we talked about our data driven decision processes taking place in socio-technical systems and becoming more dependent on the results from data analysis solutions. These underlying technical solutions can be attacked in order to disrupt the decision processes, including changing their outcomes. In order to have confidence in data driven decision-making, we need to understand the threats that the underlying data analysis processes are facing. Fortunately, we can use experience from information and software security to do that.

Most security problems result from complexity, unverified assumptions and/or dependencies on external entities. We need to understand the system, in order to protect it. This is a common problem in information and software security. We use threat modeling methodologies to evaluate the design of an information processing system in the security context. We look at the system from the attackers’ POV and try to find ways in which security properties, like confidentiality, integrity or availability could be compromised. The resultant threat model includes a list of enumerated threats, e.g. using a format like "an adversary performs action A in order to achieve a specific goal X”. We look at each of these threats and check if it is mitigated. If a mitigation is missing or incomplete, we can talk about a potential design vulnerability. We can apply the same approach to the socio-technical systems used in data driven decision processes.

This is actually what we started to do in the previous post, when we were asking questions about entry points to our system, its dependencies and the related assumptions. Below we will briefly discuss possible mitigations, which can be technical, but can also be organizational or legal. Figure 1 includes the same model of a socio-technical system as in the previous post, but this time with examples of mitigations related to the critical components.

Figure 1. A model of a socio-technical system in a decision-making with examples of possible mitigations.

Figure 1. A model of a socio-technical system in a decision-making with examples of possible mitigations.

We know mitigations for generic threats (e.g. how to store and transfer data securely), however mitigations for threats related to data analysis scenarios still need to be researched.

  • In the scope of external data sources, we want to know where the data are coming form, what transformation were applied or how missing values or outliers were handled. We can apply data quality metrics and techniques to verify data origin, but there are still scenarios that will be more difficult, for example when data are contributed by many anonymous users.
  • In case of algorithms and models, we might need information like accuracy metrics, full configurations or summaries of training and test data sets. We may periodically test the models or evaluate the results from different providers. Still, in some cases, independent certifications or specific service level agreements, covering also analysis objectives and priorities, may be required.
  • Decision makers can be protected with user experiences designed for decision making scenarios (including domain characteristics or situational requirements). These are great opportunities for analysis or visual decision support. We need to be careful with new types of interfaces, like augmented reality, as they will be connected with new types of threats against our cognitive abilities.
  • New types of threats will also emerge from integration with AI agents in decision contexts. We don’t know yet the detailed applications, however we can already think about some potential mitigations focused on measuring, analysis and controlling interactions. There are types of threats, like repudiation, that will likely be much more important in such cooperation scenarios.

In order to have confidence in data driven decisions, we need to design our processes to be reliable, trustworthy and resistant to attacks. This requires good understanding of goals and assets of our decision-making; based on that we can specify requirements for underlying data analysis and make informed decisions about selecting specific data sources and analysis components. Threat modeling can be a great tool for that, but the methodologies must be adapted to the nature of socio-technical systems, which can be very dynamic and hard to model. But there can also be new opportunities, as we could define new requirements related, for example, to transparency, accountability or independence. These requirements could be very useful for decisions with broad social impact or shared goals, which had to be agreed to between multiple parties.

Security efforts are continuous in their nature. New technologies enable new scenarios, leading to new threats, which may require new or updated mitigations. We need to continuously think about threats and cannot focus only on the opportunities and benefits of new technologies and applications. If we do, we may soon find our decision processes to be very effective and accurate, but no longer compatible with our goals and priorities.

This series of posts is based on the presentation made during Bloomberg Data for Good Exchange Conference, on September 24th 2017 (paper, slides).

Security of data driven decision-making

Our decisions processes become more data driven, in individual, social and global scope. This is a good and natural trend, which can give us hope for more accurate and rational decisions. It is possible due to 3 major changes: we have much more data, algorithms and models useful in practice, and computing resources that are easily available. These changes are not disconnected, but rather we should consider them the foundation upon which our decision processes can be constructed. Data driven decision processes therefore take place in socio-technical systems and include at least two levels: the actual decision processes, with social and business dimensions, and the level of data analysis with the software and other technical components. It is critical to have consistency between these two levels as the outcome of decision-making depends on results from underlying data analysis.

In complex systems, many things can go wrong. Different elements of socio-technical systems are susceptible to failures caused by random errors or by intentional actions of 3rd parties. In the second case, we can talk about threats against decision processes, which can be defined as any activities aimed at disrupting their execution or changing their outcome. It is interesting to note that even though the goals of an attacker are usually related to the decision processes (and their results), the actual attacks are more likely to be implemented at the data analysis level. This is simply where we have software components that can be effectively attacked. The decision process can therefore be attacked indirectly, through data analysis solutions, upon which they depend.

Figure 1 includes a simple model of a socio-technical system used in a decision-making with examples of security relevant questions that can be asked regarding its critical components. This system includes two human decision makers, with shared goals and priorities, who use internal data and analysis solutions. In addition to that, there are some external data sources and analysis services separated by the trust boundary. When looking at such a system from a security point of view, we would usually start with the inbound data flows – since all untrusted input data needs to be validated. If we were concerned about the privacy of our data, we should also look at the outbound data flows, to get full understanding what data are exported to systems outside our control.

Figure 1. A model of a socio-technical system in a decision-making with examples of security questions regarding its critical components

Figure 1. A model of a socio-technical system in a decision-making with examples of security questions regarding its critical components

Such a review quickly becomes much more complex when we move to data analysis scenarios as the base for decision-making.

  • In the scope of external data sources, we are not only interested in the format of the data, but also in their quality, credibility or completeness. Can we trust the data to accurately represent the specific phenomena we’re interested in? Please note, that questions like that are not only applicable to data we consume directly, but also to data used by any analysis service we interact with.
  • When it comes to external analysis services, there is a lot of discussion about algorithm bias or the practical quality of models. It doesn’t help that many algorithms and models are black boxes due to their proprietary nature or selected business models. And again, this brings us to the questions about trust – will we get the results that we need and expect?
  • The 3rd group of key elements includes decision makers, who need to apply the results to the context of specific problem domain and decision situation. Their roles, tasks and types of interactions depend on a specific application scenario, but they are always operating under some constraints (e.g. time pressure), with cognitive limitations, that can be taken advantage of.
  • This model will get even more interesting with AI agents joining our decision processes and operating as frontends to external analysis services or as active participants. In interactive cooperation scenarios, it is harder to control what information we are sharing. The questions about operational objectives and priorities of the agents will become very relevant.

We cannot focus only on benefits and opportunities of new technologies and scenarios; we need to think also about new threats and their implications. Security is critical for any practical applications, that obviously includes also decision-making based on data analysis. We need to design these processes to be reliable, trustworthy and resistant to attacks. This applies even to basic scenarios, with seemingly simple decisions like selecting an external data source or trusting a provider of data analysis services with our data. In the following post, we will talk about using experience from information and software security to better understand our systems and making more informed decisions.

This series of posts is based on the presentation made during Bloomberg Data for Good Exchange Conference, on September 24th 2017 (paper, slides).

Visual Decision Support

In this blog post, we'll use examples from the first prototype that was implemented at Salient Works - the set of libraries and applications for decision support in air traveling scenarios. The primary motivation for that project was to address challenges related to long distance air travel, which can be very stressful, even when everything is going according to plan. They usually start with selecting a connection, when a traveler may experience information overload as different options are difficult to compare. During a trip, transfers between flights can be especially overwhelming due to time zones, unfamiliar airports and overall travel fatigue. In that context any unexpected event, like a missed or cancelled flight, can be traumatic, especially for elder or less frequent flyers. Many of these factors cannot be controlled, but we can build technical solutions to keep users comfortably informed, assist them at critical points and facilitate their interactions with other entities (like airlines).

Such solutions require effective presentation of information, usually in a visual form (though other types of interfaces can be also applied). We plan to publish a dedicated post about visualization as an essential part of data analysis, but here we’d like to talk about a more specific scope – role of visualization in decision support. We refer to visual decision support to describe situations when the user experience in a decision scenario is built around a visualization pattern specifically designed to address requirements of this scenario, with all its context and constraints. In practice, it means that all information required to make a correct decision, or series of decisions, should be delivered to a user at the right time and in the form adapted to user’s situation and most probable cognitive state. In our prototype applications, the relevant information is mostly related to time and space orientation and it should be presented in a way that reduces probability of errors (e.g. caused by lack of sleep) and stress related to operating in an unknown environment.

Let’s move to specific examples from our prototype. The main idea was to design a simple and universal visualization pattern that could be consistently used throughout different stages of a travel experience, including planning, the actual trip and dealing with emergencies. An example visualization of a trip between Seattle and Poznan using this pattern is presented in Figure 1. The pattern is built around time as perceived by the traveler (horizontal axis) and we placed a special emphasis on critical time points like beginning of each trip segment, as well as translating time zone differences upon arrival at a destination. The grayed area in the background indicates night time, so it should be easier for a traveler to plan working and resting during a trip. Creating such a visualization is the first step, as it can be customized and personalized (also for accessibility), used in a static itinerary (see example from our prototype) or in a dynamic companion application and updated with current details, such as a departure gate.

Figure 1. An example visualization if a trip between Seattle and Poznan

Figure 1. An example visualization if a trip between Seattle and Poznan

One key property of this pattern that may not be immediately obvious is the dimension of vertical axis - in the configuration of our examples it is based on latitude of visited airports. This property was introduced in order to create unique shapes for different trip options and to make a selected one look familiar and recognizable. After all, the same visual representation is about to be used during different stages of a trip, starting with its planning. This is actually the stage when the uniqueness of shapes turned out to be the most useful since it made comparison of available options much simpler and cleaner. Figure 2 contains examples of 5 different options for a trip from Seattle to Paris. As you can see, they are all presented using the same time range, so they are much easier to compare, including departure and arrival times, as well as layovers’ durations. We conducted limited usability tests and found out that this approach works also for comparing a significant number of options (see multiple results for the same query), especially when combined with multistage selection. Using our visual pattern, we were able to build a fully visual experience for trip searching, comparing and selection.

Figure 2. Comparison of 5 different options for a trip from Seattle to Paris

Figure 2. Comparison of 5 different options for a trip from Seattle to Paris

This was our first big project at Salient Works and we spent way too much time on its design and prototyping. In addition to core and support libraries, we built a visual search portal (integrated with Google QPX), functionality for generating personalized itineraries and even a proof of concept for a contextual app with a demo for re-scheduling a missed or cancelled connection. Unfortunately, we were not able to establish working monetization scenarios or find partners to introduce our prototypes into production. But we gained a lot of experience, which we later used in development of our framework, where we implement concept of visual decision support in a more flexible way, through application of analysis artifacts associated with different domain libraries and templates. And our prototypes may still find their way into production environments, as we recently came back to the project and adapted this pattern to visualization of flight time limitations, with pilots and other flying personal as intended users.

Data analysis in social context

In the previous blog post we talked about the social context of our decision-making processes. We used the example from the healthcare domain to show that decision making these days rarely occurs in isolation and that technical solutions aimed at supporting these processes need to become essentially social. In this post, we will take a step further and talk a bit about designing data analysis solutions to be effective and useful in social and business contexts. These contexts are dynamic and usually more complex that they might seem. They include multiple elements, roles, types of relationships and structures; can be designed and constructed, or grown organically; can exist continuously in background (everybody has multiple ones) or have a short lifespan tied to a specific purpose or situation. Such diverse characteristics can result in completely different functional requirements, what means for data analysis solutions that they need to be very flexible and adaptable.

Data analysis in social context is about sharing, but not only of data and results, but also of efforts, skills, experiences, and - probably the most important here – different points of view. There are some technical elements that are common in all such solutions, including efficient  data exchange that enables natural and smooth interactions, navigation through complex data spaces, and management of relationships (sometimes completely new types). We can also try to identify some higher-level principles that help with building effective and useful solutions for various social contexts:

  • Focus is on users as the centers of social contexts. This starts with a personal user experience and need for understanding individual requirements and preferences. But it can quickly get even more difficult, if we have multiple users with incompatible or conflicting goals. There is a need for clarity (do these agents really operate according to my priorities?) and transparency (who can access data or control the process?). In many situations, analysis decision support may include defining contract-based goals and rules of data analysis efforts (e.g. solving a specific problem).
  • Data analysis processes are distributed efforts. The scope of data analysis in social context expands from an individual, into groups, communities and eventually societies. This requires effective interactions between multiple participants, both human and agents, across shared data spaces. Here the requirements can be very different and a solution must support various scenarios covering cooperation, negotiations or competition. There can be also the challenges of integrating individual experiences (each with possibly different presentation) into consistent group communication system.
  • Data analysis process is usually part of a bigger system. Problems and contexts are unique; types of tasks, best practices, patterns and challenges are more general. A data analysis process can benefit from similar external projects (e.g. for population big picture) and contribute to them (with anonymized data). There are opportunities for sharing competencies, efforts and solutions even externally, in open, research or commercial frameworks. However, integration scenarios require very clear consistent rules and transparency regarding privacy, security or ownership of information.
  • Intelligent agents can be essential participants of data analysis. Interactions during analysis or decision making process can take place in networks of human and non-human actors. Intelligent agents can be interactive participants, sharing information with users or performing specific tasks per request. They can also operate in the background, monitoring actions, conversations or external events, and acting when it is needed or useful. In group scenarios, they may take special roles, like optimizing of efforts, balancing the structure, or mediating with odd or even number of agents.

Let’s take a quick look at that last point, as it seems to be the clearest illustration of relationships between technology and social contexts. We will reuse the example from the healthcare domain, introduced in our previous blog post, which shows relationships between a patient’s context (family and friends) and the physician’s context (professional medical network). Figure 1 presents that structure, with the addition of new connections involving intelligent agents, some interactive and others operating in the background. Interactive agents can provide direct assistance and support to patients, their friends and families, along with connections to the medical side, where different types of agents can help with coordination of efforts and collaboration in medical analysis. Background agents can enable various scenarios, like continuous remote monitoring (not only in the scope of physiological metrics), integration with population efforts (connecting physicians working on similar cases) or automatic documentation of decision processes.

Figure 1. An example of a social structure in healthcare combining humans and intelligent agents

Figure 1. An example of a social structure in healthcare combining humans and intelligent agents

Similar scenarios may seem distant, but they are already here, although usually in simpler configurations with a bot or a digital assistant as front-end to a realm of specific services. In the scope of data analysis, including a social context is a natural consequence of focusing on the user’s goals, needs and preferences. In our framework, this focus starts with personalized user experiences based on individual choices and activities. For groups scenarios, it is expanded to also include the user’s role, relationships and characteristics of a social or business context. At this point data analysis is no longer only about sharing, but also about communication and conversations embedded in a shared data space. Intelligent agents can fit in such spaces very naturally and become the key participants. An agent can interact with users, change their behaviors or even become an active driver of interactions between different users and agents. The result is a completely new social structure - technology is not only capable of adopting to a social context, but may shape it or, in some cases, construct it.

Human elements will long remain fundamental in solving real problems and there are great opportunities for solutions facilitating cooperation in complex scenarios. There are situations, where enabling efficient cooperation may actually be more important than selecting the right algorithms and analysis techniques. The data analysis solutions must however be designed for social and business contexts, with clear rules and transparency, always close to users and actively addressing challenges like possible incompatibilities in priorities between individuals or an individual and a group. Including social context in data analysis is becoming however unavoidable, due in part to the increasing popularity of conversation-based interactions. And with the application of intelligent agents, social context is added to all data analysis projects, even those conducted by a single user.